Students will learn about DNA base pairs. As a team they will send a student to read a sequence of DNA/RNA and will have their group duplicate or sequence the complimentary base pair. Students will
Hike the trail to the Fort Bowie visitor's center and collect data on plants and artifacts you see there. This lesson involves data collection in the field and creative graphing in the classroom.
This lesson introduces a phenomenon to start a unit on the properties of matter. Students will plan and carry out a investigation of an unknown mixture and collect data. In doing so, they will begin
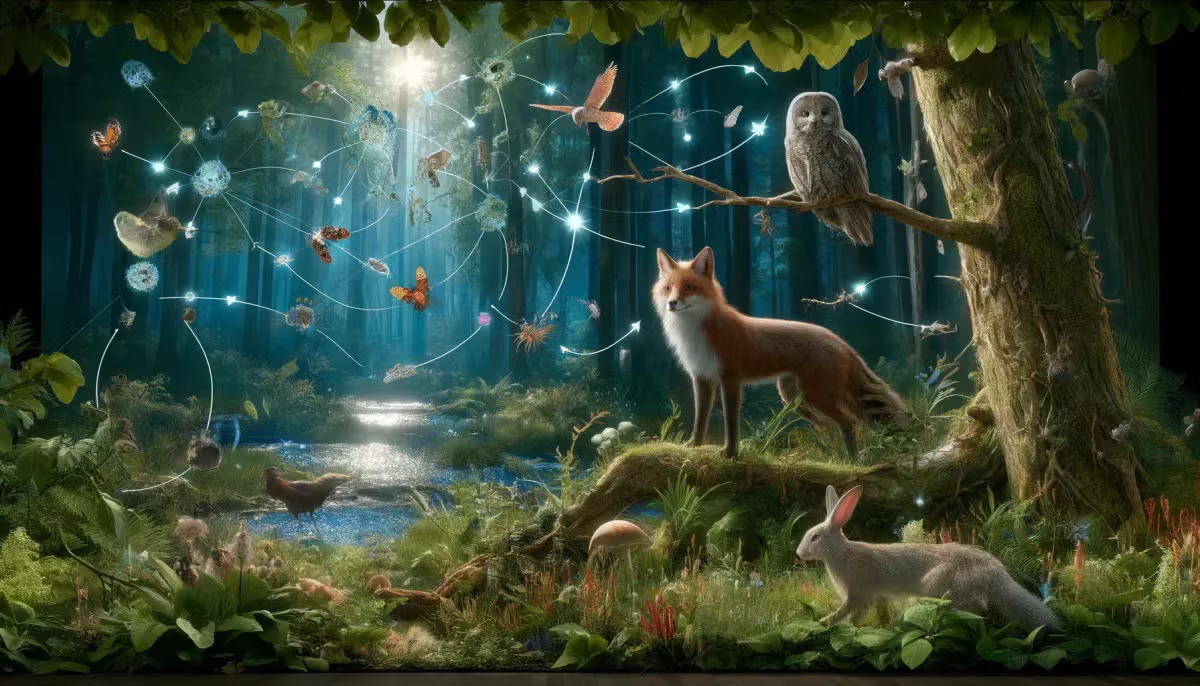
In this lesson students combine science and math standards to explore the animal adaptation: camouflage. Students engage in discussion, watch a video, complete a hands-on activity, fill out a table
This hands-on lesson plan includes a lab that can be done to understand cell membrane properties. Students will provide evidence to support the claim that all biological systems demonstrate some
This lesson is all about force and the influence it has on the motion of an object. In this lesson plan, students will be challenged to design a sturdy paper human house that can withstand force (wind
Engage your young learners in an exciting journey through the world of STEM with our "Balloon Rocket Race" lesson! Designed specifically for 1st-grade students, this interactive and hands-on lesson
This lesson is a four-day unit lesson that highlights the understanding of the climate, geography, trends in the change of temperature, and the related changes in precipitation in the state. This
This is a 6-week lesson plan for high school students designed to measure and then increase the bat population in the field behind our school. This can be used in any area where bats populate, as long