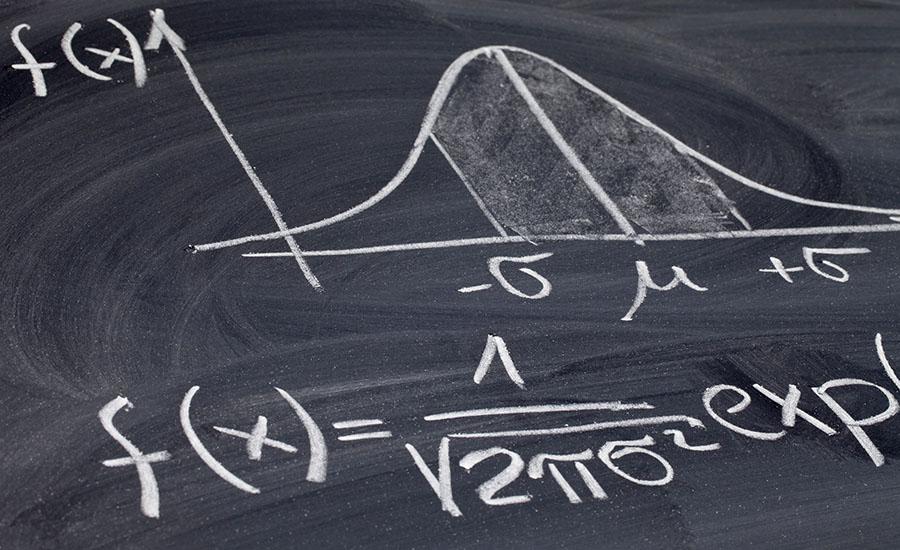
Human Dot Plot - Part 1
by Laura Richmond
Students will create dot plots (both physically and using technology) to represent class data, determine important statistics, and interpret those statistics in context.
Lesson Plan Link/URL
https://docs.google.com/presentation/d/1B2TIjWXOO1cWWeMdcJSWCYOURvmhOwHs/edit?u…Related Content

Grades:
9th Grade, 10th Grade, 11th Grade, 12th Grade
This lesson uses a Modeling Instruction approach to developing the graphical and mathematical relationships for Circular Motion for students in Grades 9-12. Students design an experiment, collect data

Grades:
9th Grade, 10th Grade, 11th Grade, 12th Grade
Using the Introduction to Hydroponics lab, introduce students to the features of the Hydroponic Systems. Students will explore the different types of grow mediums and grow lights used in the systems

Grades:
9th Grade, 10th Grade, 11th Grade, 12th Grade
This lesson introduces students to the logistic growth function as a model of population growth with limiting factors. Students will compare exponential and logistic growth, interpret key parameters