Students will be extracting DNA from strawberries to help them understand DNA and its role in heredity and inheritance. Students will also practice math skills and compare data.
In this 6th grade STEM lesson, students explore the real-world challenges of renewable energy by designing and testing simple solar oven and wind turbine models. Working collaboratively, they will
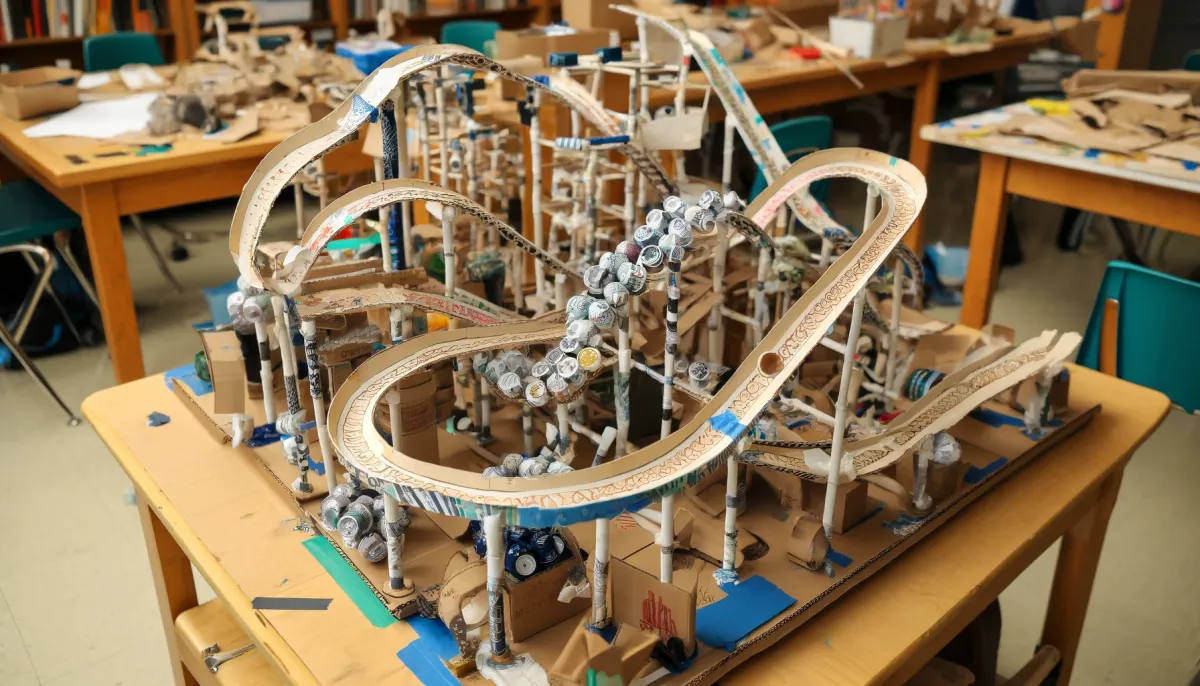
Students design and build eco-friendly theme park rides using recycled materials to model energy efficiency, test data, and explore sustainable power sources through STEAM.
This lesson introduces students to the logistic growth function as a model of population growth with limiting factors. Students will compare exponential and logistic growth, interpret key parameters
This lesson builds on student understanding of what how box plots summarize data sets and develops student knowledge of how to compare two sets of data using box plots and their five number summaries
Students will review heredity and genetics using this lesson plan. Students will have an opportunity to explore generations, genetic variations, pedigrees and fitness using this lesson plan and PhET
This lesson supports students in physically understanding how data values are summarized and represented with a box plot. Students will also use an online tool in order to create one.
Students will be measuring the heights of two groups to compare the averages, minimums, maximums, and standard deviations of normal distributions by using the functions on Google Sheets.
The lesson looks at three driving questions: Is there an association between human height and wingspan? How can analyze a set of data to determine associations between these two variables? How can we