
Human Dot Plot - Part 1
by Laura Richmond
Students will create dot plots (both physically and using technology) to represent class data, determine important statistics, and interpret those statistics in context.
Lesson Plan Link/URL
https://docs.google.com/presentation/d/1B2TIjWXOO1cWWeMdcJSWCYOURvmhOwHs/edit?u…Related Content

Grades:
9th Grade, 10th Grade, 11th Grade, 12th Grade
In this lesson, students explore how scientists identify bacteria by analyzing the 16S ribosomal RNA gene. Through hands-on activities and bioinformatics tools, students learn the process of

Grades:
9th Grade, 10th Grade, 11th Grade, 12th Grade
Code an if/then text based adventure game with Flowgorithm. Flowgorithm is a unique coding environment different from Scratch because it uses core coding concepts of flowcharts to demonstrate working
Grades:
6th Grade, 7th Grade, 8th Grade, 9th Grade, 10th Grade, 11th Grade, 12th Grade
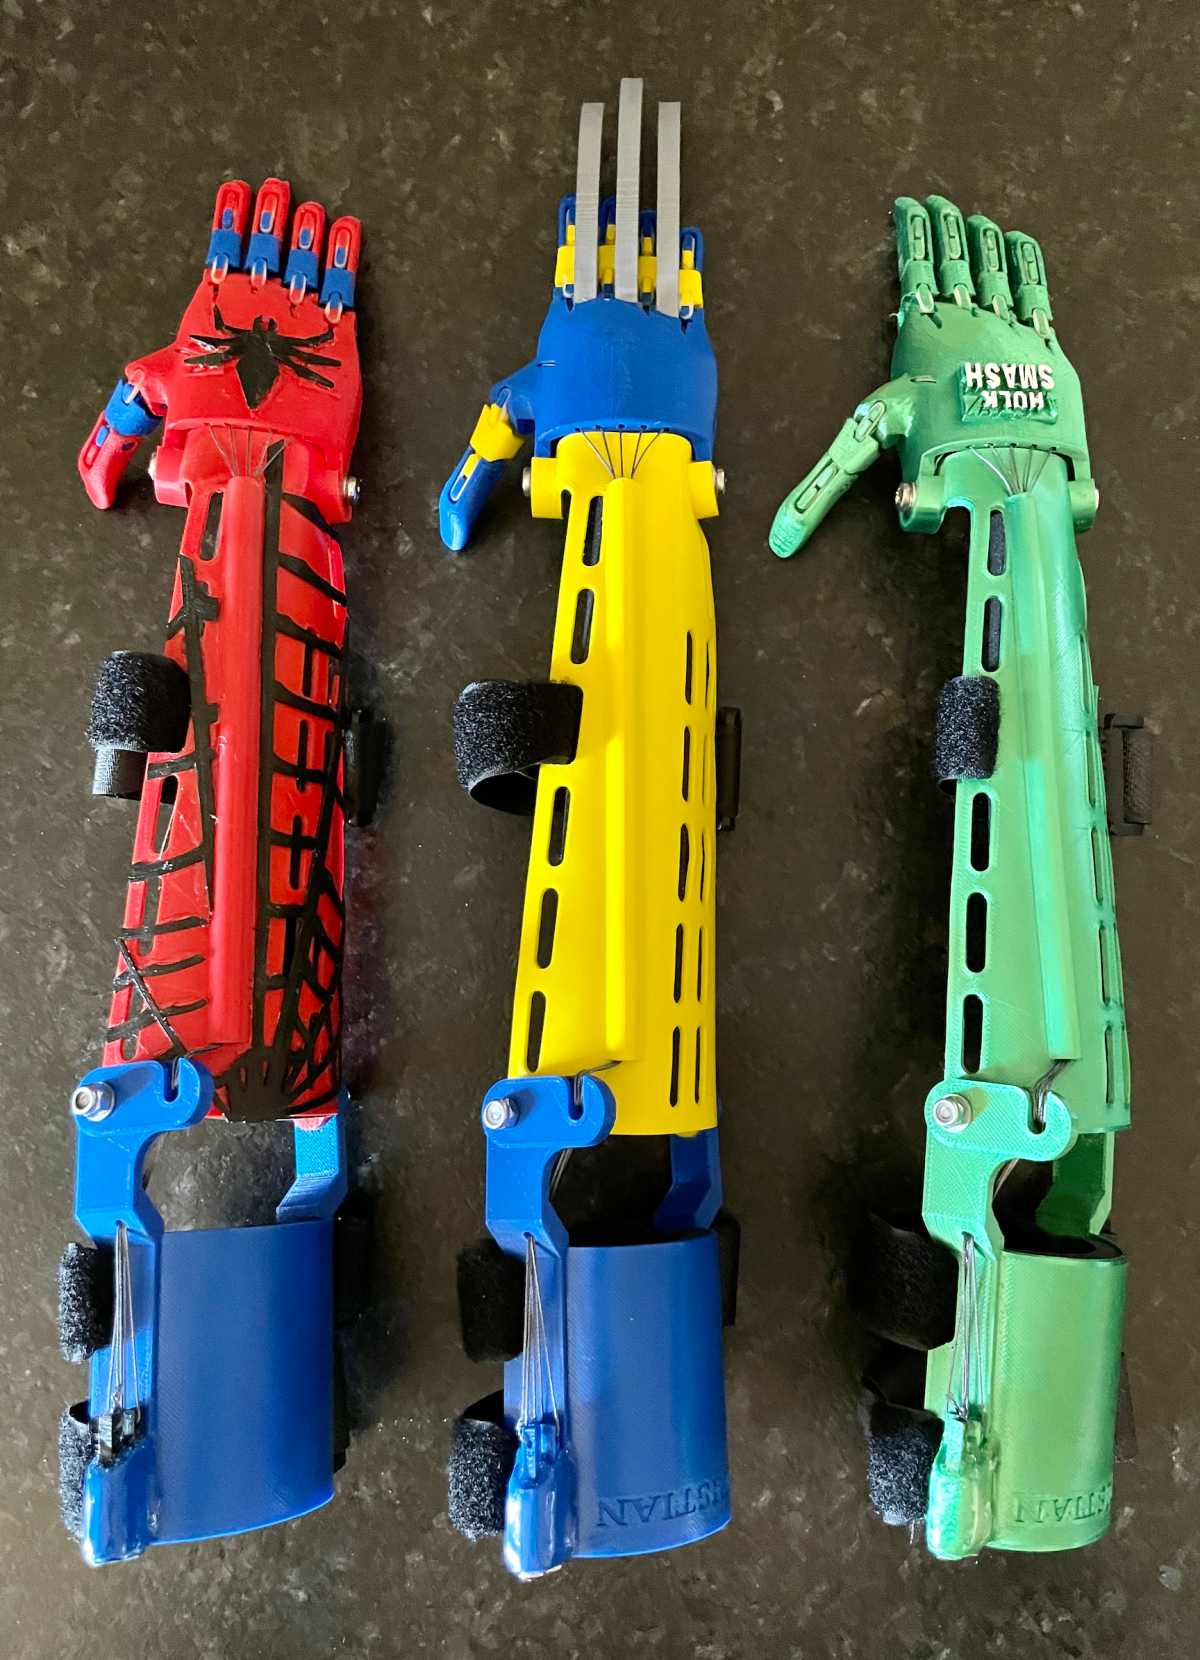
Be a part of the humanitarian effort and teach students how to create a fully functioning 3D printed prosthetic arm for a client in need. This lesson walks you through the process in a slideshow