Grades:
7th Grade, 8th Grade, 9th Grade, 10th Grade, 11th Grade, 12th Grade
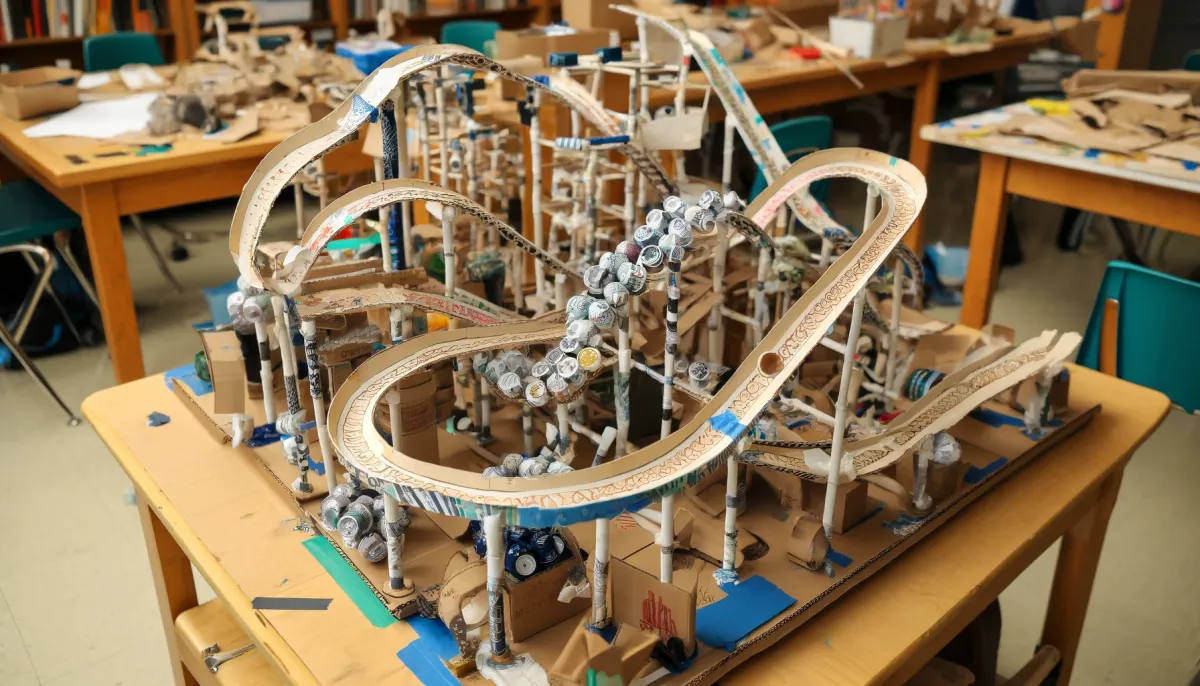
Students will apply principles of design, engineering, and mathematics to create a physical or digital labyrinth inspired by the myth of Theseus. This project integrates STEM concepts with literature

Grades:
9th Grade, 10th Grade, 11th Grade, 12th Grade
In this lesson, students will explore the key physics principles that govern the design and operation of street lighting systems. Through a hands-on engineering design challenge, students will apply

Grades:
7th Grade, 8th Grade, 9th Grade, 10th Grade, 11th Grade, 12th Grade
The students in this lab activity will play a competitive game with a small bouncy ball. The students will analyze the motion of the ball and apply projectile motion concepts. This activity requires
Grades:
7th Grade, 8th Grade, 9th Grade, 10th Grade, 11th Grade, 12th Grade
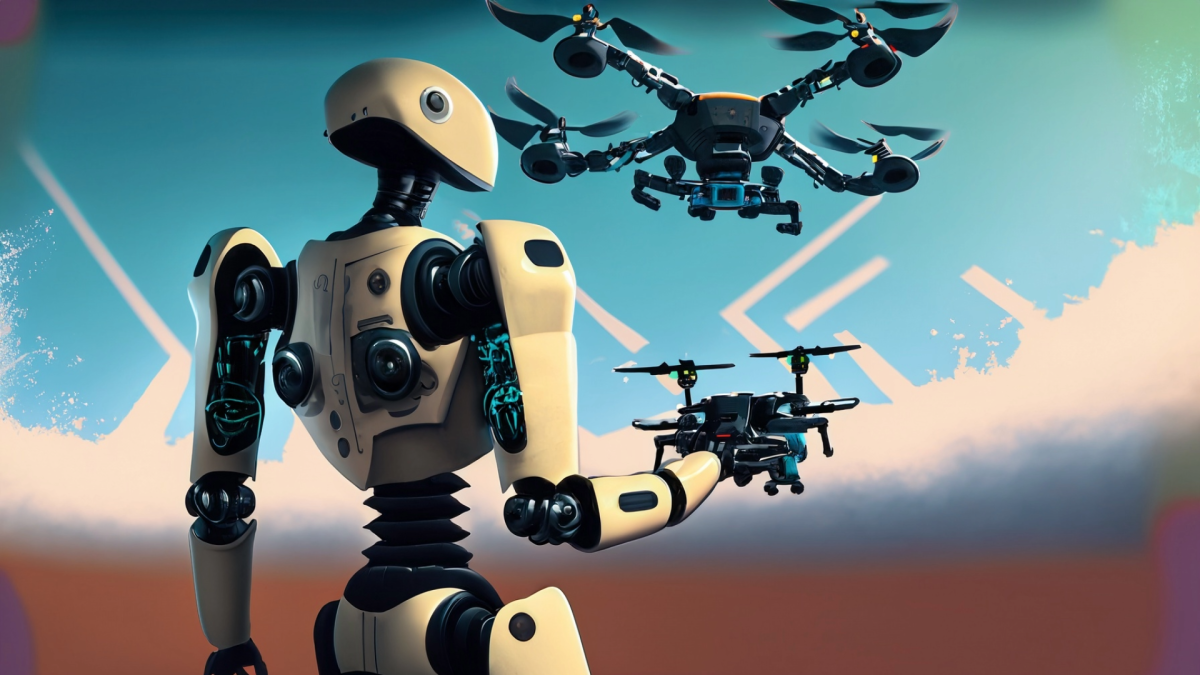
In this lesson the students will develop the code they previously planned out and will deploy their code to the drone. They will continue the process of reflection and iterative improvement. This is
Grades:
7th Grade, 8th Grade, 9th Grade, 10th Grade, 11th Grade, 12th Grade
In this lesson students will collect data on the performance of their drone. Students will design a systematic process of data collection that will then lead to the development of a predictive model
Grades:
7th Grade, 8th Grade, 9th Grade, 10th Grade, 11th Grade, 12th Grade
This is a lesson where students will learn about the sensors that are integrated into their drones and how students can get a live feed of information from these sensors to aid in autonomous decision
Grades:
7th Grade, 8th Grade, 9th Grade, 10th Grade, 11th Grade, 12th Grade
In this lesson students will think back on all of the coding skills they have learned and will plan out their code to fly their drone through their maze based on sensor feedback. It is important that
Grades:
7th Grade, 8th Grade, 9th Grade, 10th Grade, 11th Grade, 12th Grade
This is an investment lesson where students will learn about how to code with loops and logical statements and they will test what they learn by developing code to fly their drones. This one lesson

Grades:
7th Grade, 8th Grade, 9th Grade, 10th Grade, 11th Grade, 12th Grade
Students will combine science and art by using an alternative photographic process called cyanotypes or sun prints. After a short introduction to the history of cyanotypes and the process of creating
Grades:
8th Grade, 9th Grade, 10th Grade
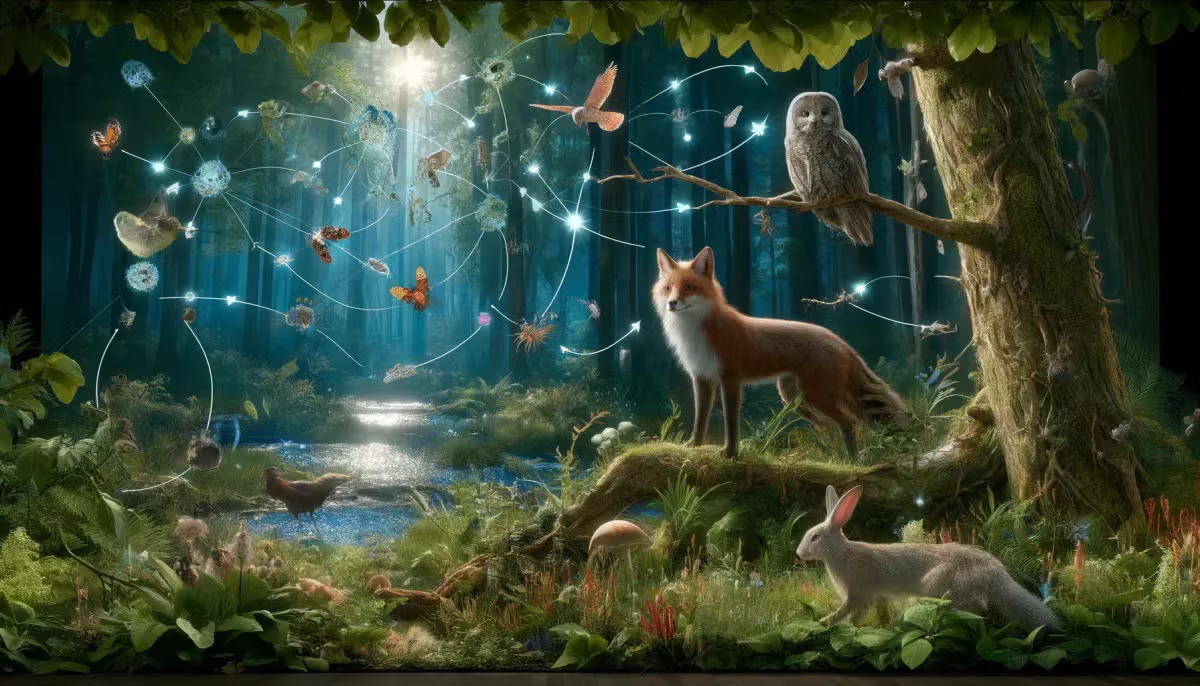
This is part of an Ecology Unit, where students will create a food web using a set of cards. Students will identify the organisms in the different trophic levels, create a series of food chains, then

Grades:
7th Grade, 8th Grade, 9th Grade, 10th Grade, 11th Grade, 12th Grade
This is a lesson geared toward junior high and high school classes to introduce students to the idea of cryptography and encryption. This lesson could be simplified for younger students by removing
Grades:
9th Grade, 10th Grade, 11th Grade, 12th Grade
In this engaging lesson, students move the learning from within the classroom to outside its walls in order to study and record air quality readings (with no tech and tech applications). Students gain
Grades:
7th Grade, 8th Grade, 9th Grade, 10th Grade, 11th Grade, 12th Grade
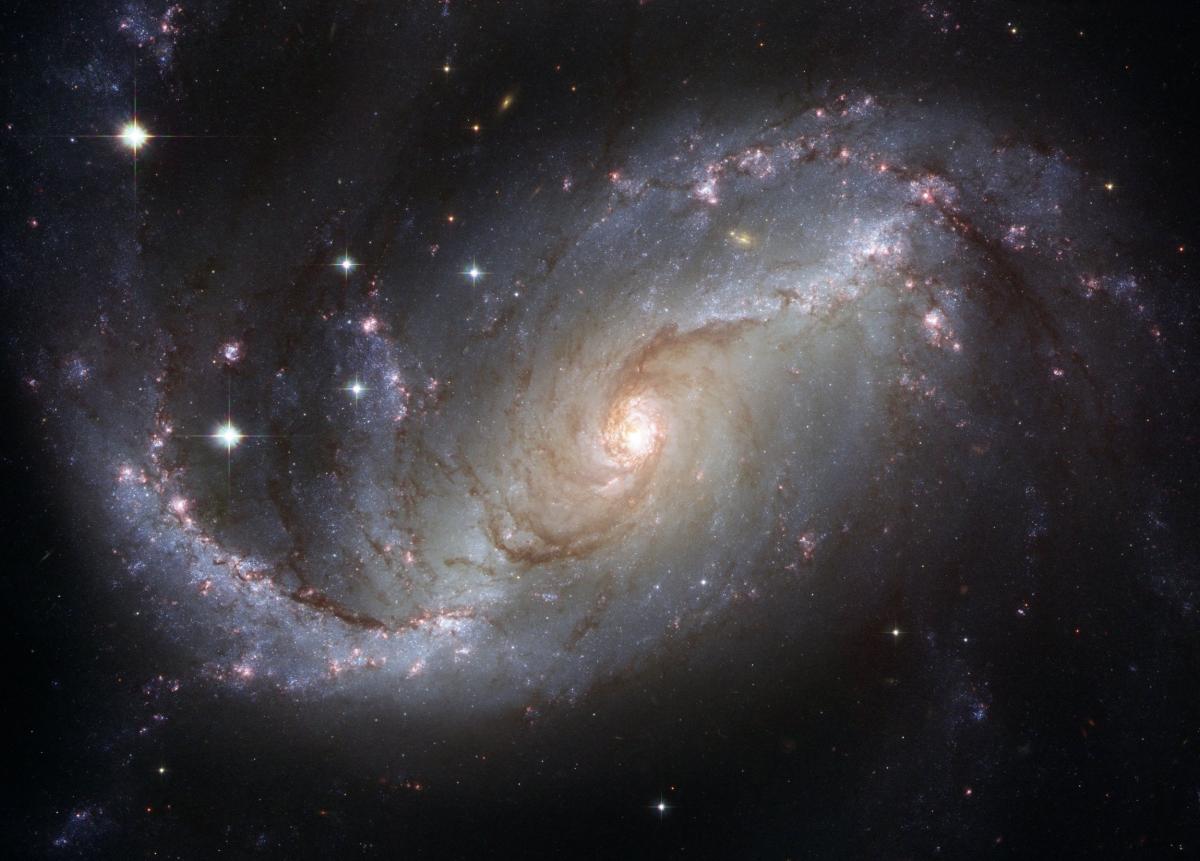
This is an introduction to exoplanets and their discovery. In the hands-on activity, students make a lightcurve for an exoplanet transit using data from the DIY MicroObservatory Telescope Network.
Grades:
9th Grade, 10th Grade, 11th Grade, 12th Grade
This is a continuation lesson in which we compare student data to the previous day's data using GeoGebra to help us generate dot plots and calculate statistics.
Grades:
9th Grade, 10th Grade, 11th Grade, 12th Grade
Students will create dot plots (both physically and using technology) to represent class data, determine important statistics, and interpret those statistics in context.

Grades:
5th Grade, 6th Grade, 7th Grade, 8th Grade, 9th Grade, 10th Grade, 11th Grade, 12th Grade
Student learn to code robots using VEXs free VEX VR code.
Grades:
8th Grade, 9th Grade, 10th Grade, 11th Grade, 12th Grade
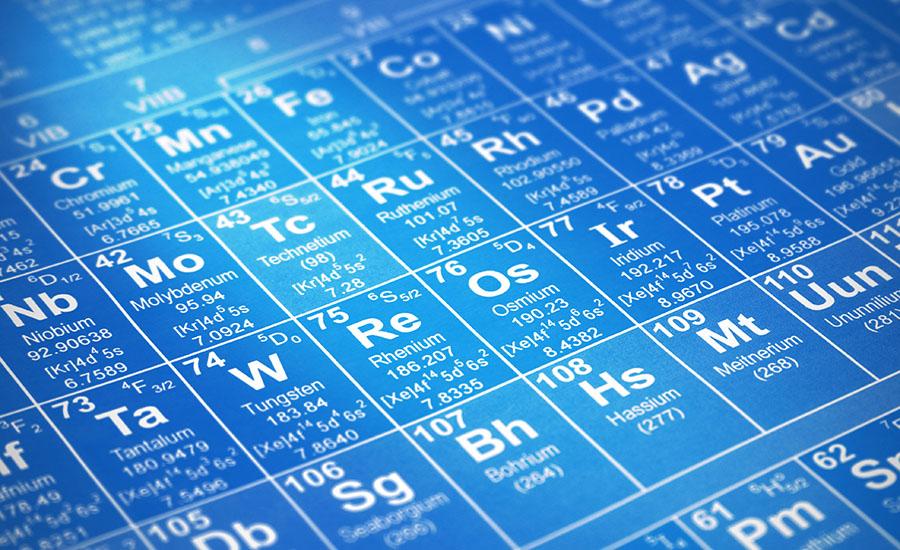
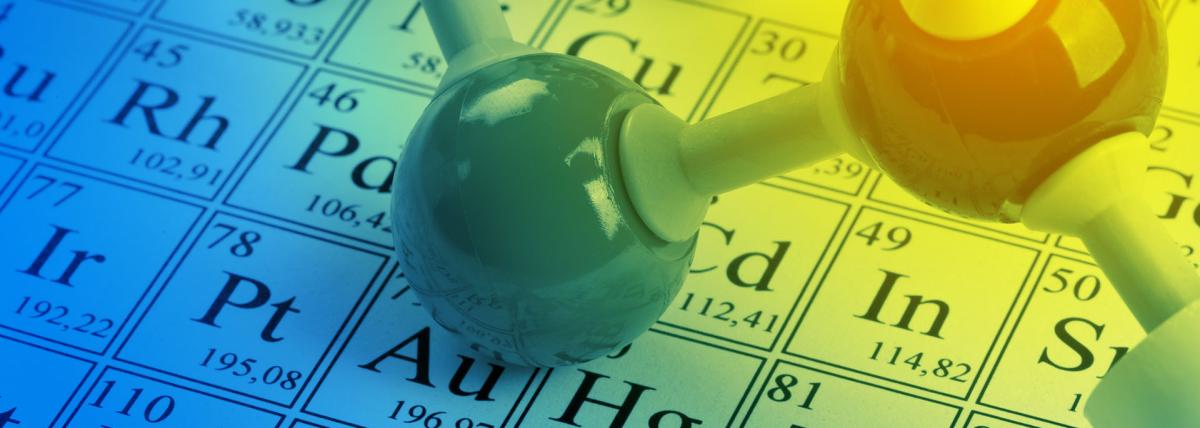
Students learn about the chemistry that exists in some of the world's oldest surviving paintings. This lesson is the final part of a 3 part painting series, and focuses on binding agents in paint
Grades:
9th Grade, 10th Grade, 11th Grade, 12th Grade
This set of lessons allows students to model the decay chains of radioactive isotopes and relate the mathematical patterns and scientific concepts together in a innovative and interactive way.
Grades:
10th Grade, 11th Grade, 12th Grade
The purpose of this lesson and laboratory exercise is for students to gain an understanding of chemical reactions and how they work. The students will have the opportunity to see a reaction between
Grades:
9th Grade, 10th Grade, 11th Grade, 12th Grade
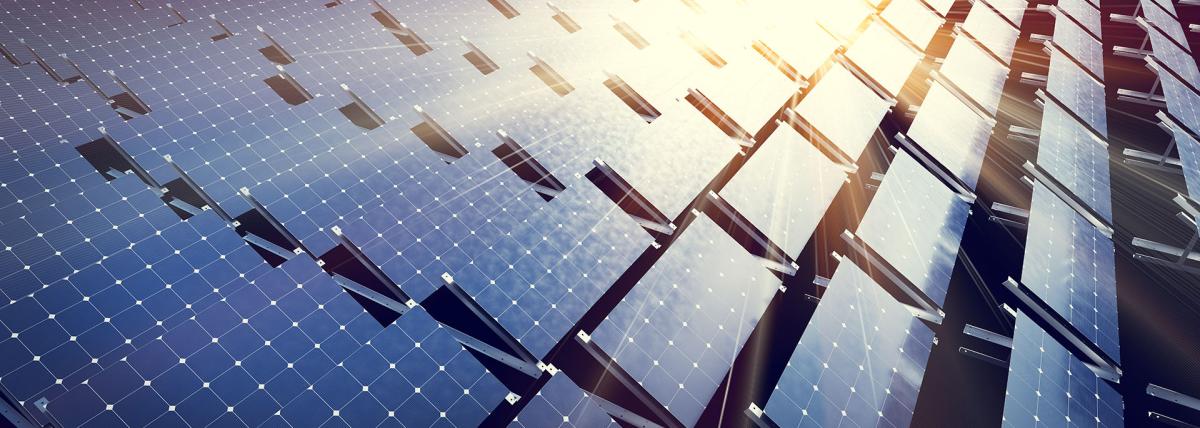
An investigation into the function and uses of solar panels in agriculture - Agrivoltaics. Exploring how to get the most efficient use of your solar panels for your gardens.
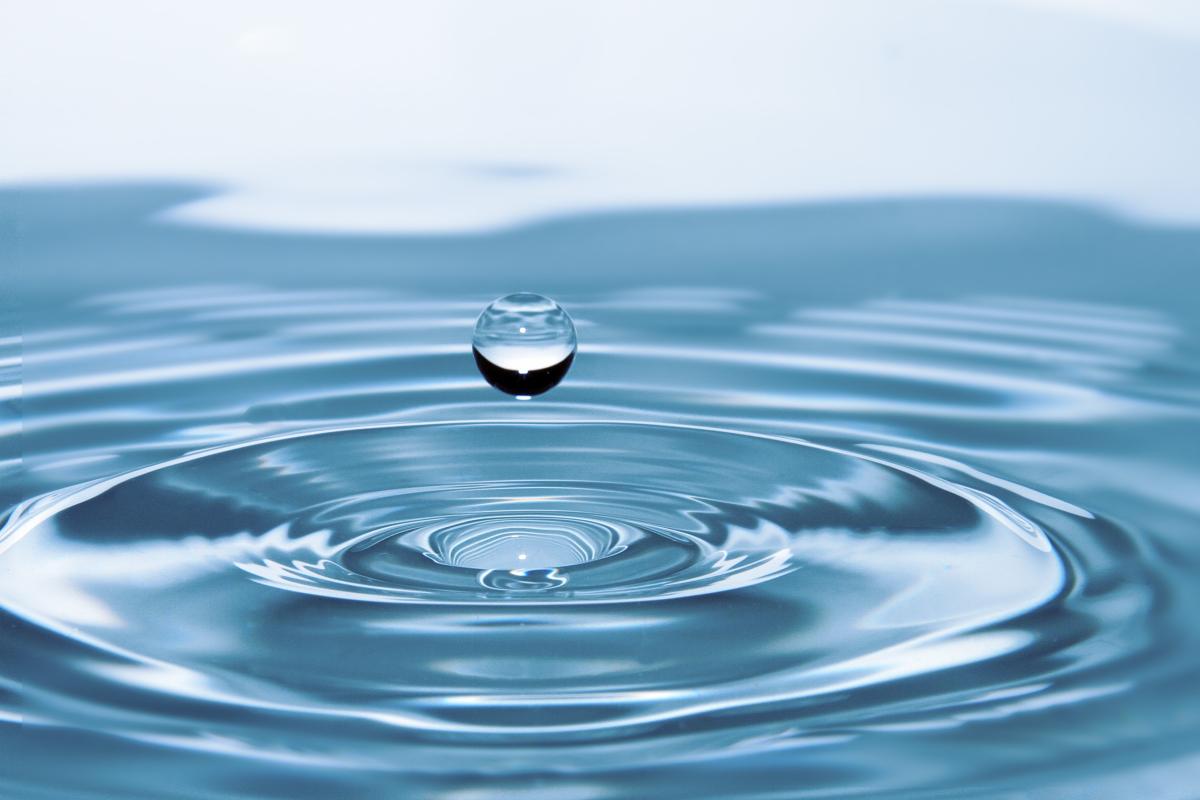
Featured
Splash of Science
Grades:
7th Grade, 8th Grade, 9th Grade, 10th Grade, 11th Grade, 12th Grade
Students measure the temperature of water as it cools to learn about heat transfer and thermal properties while using line of best fit, linear regressions and/or quadratic regressions.
Grades:
9th Grade, 10th Grade, 11th Grade, 12th Grade
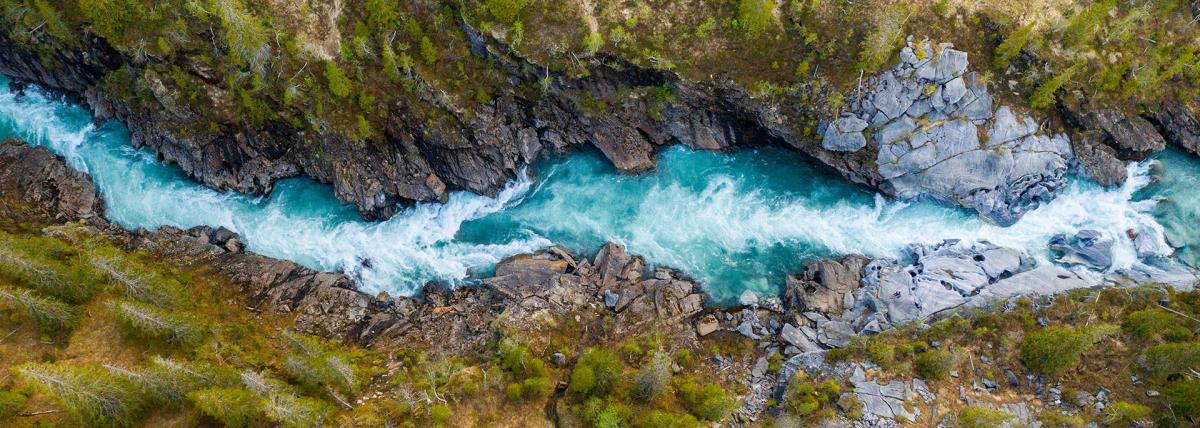
A lesson to teach students how to collect, organize, interpret data, make inferences, raise awareness, and suggest possible solutions on the water quality of the waterbodies in the state of Arizona.
Grades:
9th Grade, 10th Grade, 11th Grade, 12th Grade
This is the first of a series of lessons where students will build a robotic rover using the BBC micro:bit. In this lesson, students will determine the proper diameter for M3 bolts by making test
Grades:
9th Grade, 10th Grade, 11th Grade, 12th Grade
This lesson introduces the students to what are antibiotics, how they work, and why they are important. At the same time, it also talks about how an organism becomes antibiotic resistant. The students