
In this lesson, students will be introduced to the phenomenon of paper/air pressure rocketry. Students will make a memorable and hands-on connection with the transfer of energy when they create and

In this lesson, students will be introduced to the phenomenon of paper/air pressure rocketry. Students will make a memorable and hands-on connection with the transfer of energy when they create and
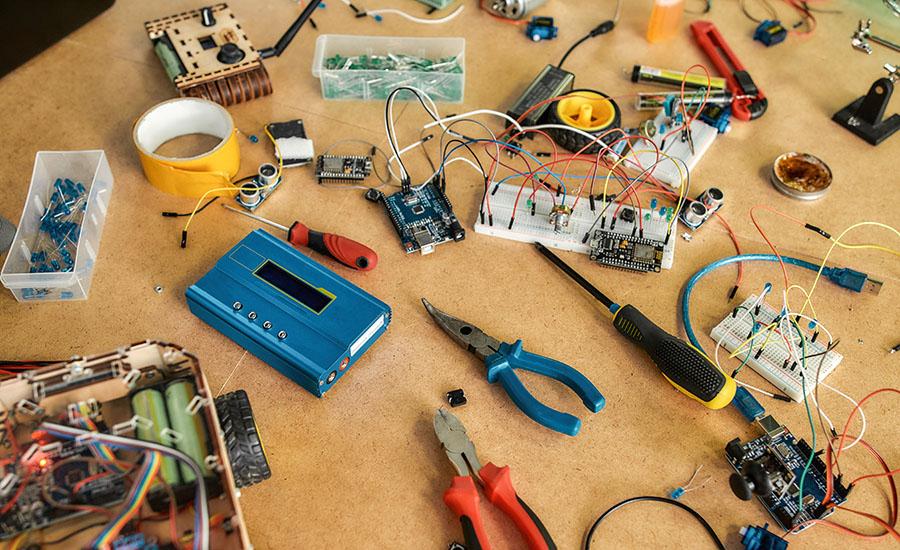
Let's talk about waste! Situation: Many items are thrown in the trash every day at school. As a class, track data to determine what the top 5 most frequently discarded items are on your campus
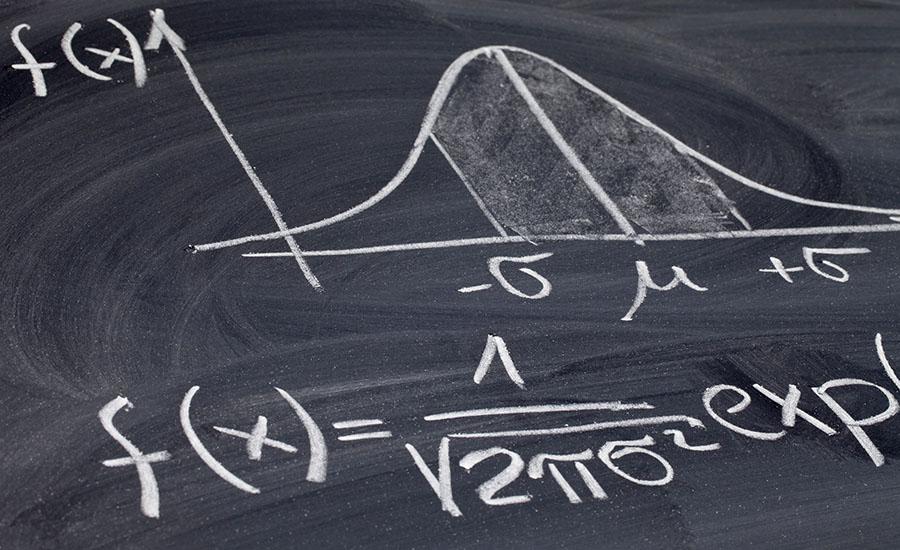
In this activity, students will use a table to organize information, create a graph to display data and use the correct labels. Students will also recognize the relationship among the table, the graph
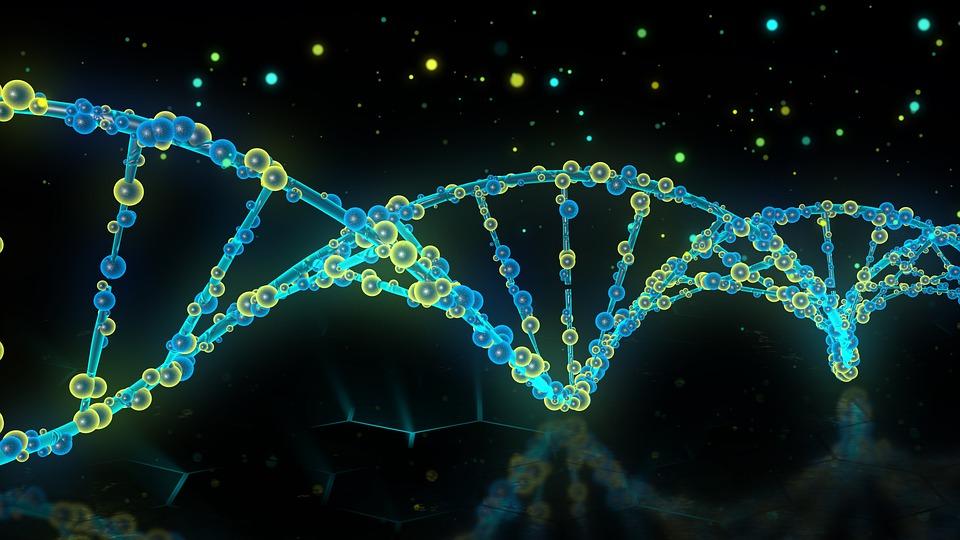
Students explore genetics and create a model to represent how genes are passed down from a parent plant to an offspring plant. This lesson could be adapted to address 1st Grade Life Science Standard

Students will focus is on the historical time period of 1763- 1900 CE. The objective is to select a historically accurate person and research the person's story. Then students will plan, create
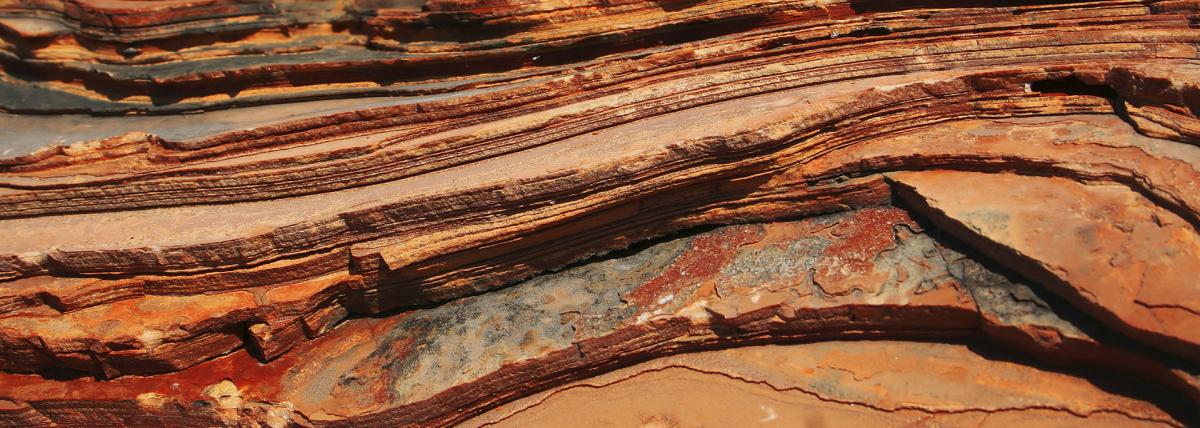
The lesson introduces how the earth layers and the fossil record shows a relative time scale. The math concept of a function will be explored. Students will use cause and effect changes of Earth
Explore temperature and weather with students. Teachers will guide students through this graphing and research activity. The unit opens with a literacy component, Global Warming with Seymour Simon

An integrated fourth grade math and geography lesson. This lesson is aligned to the ADE/NGSS Cross Cutting Concept of Scale, Proportion, and Quantity. The fourth grade social studies/geography

Students will engage in a phenomena based lab in which they simulate relative dating of sedimentary rocks, an earthquake and volcanic eruption. In the lab, students will see how the layers at the