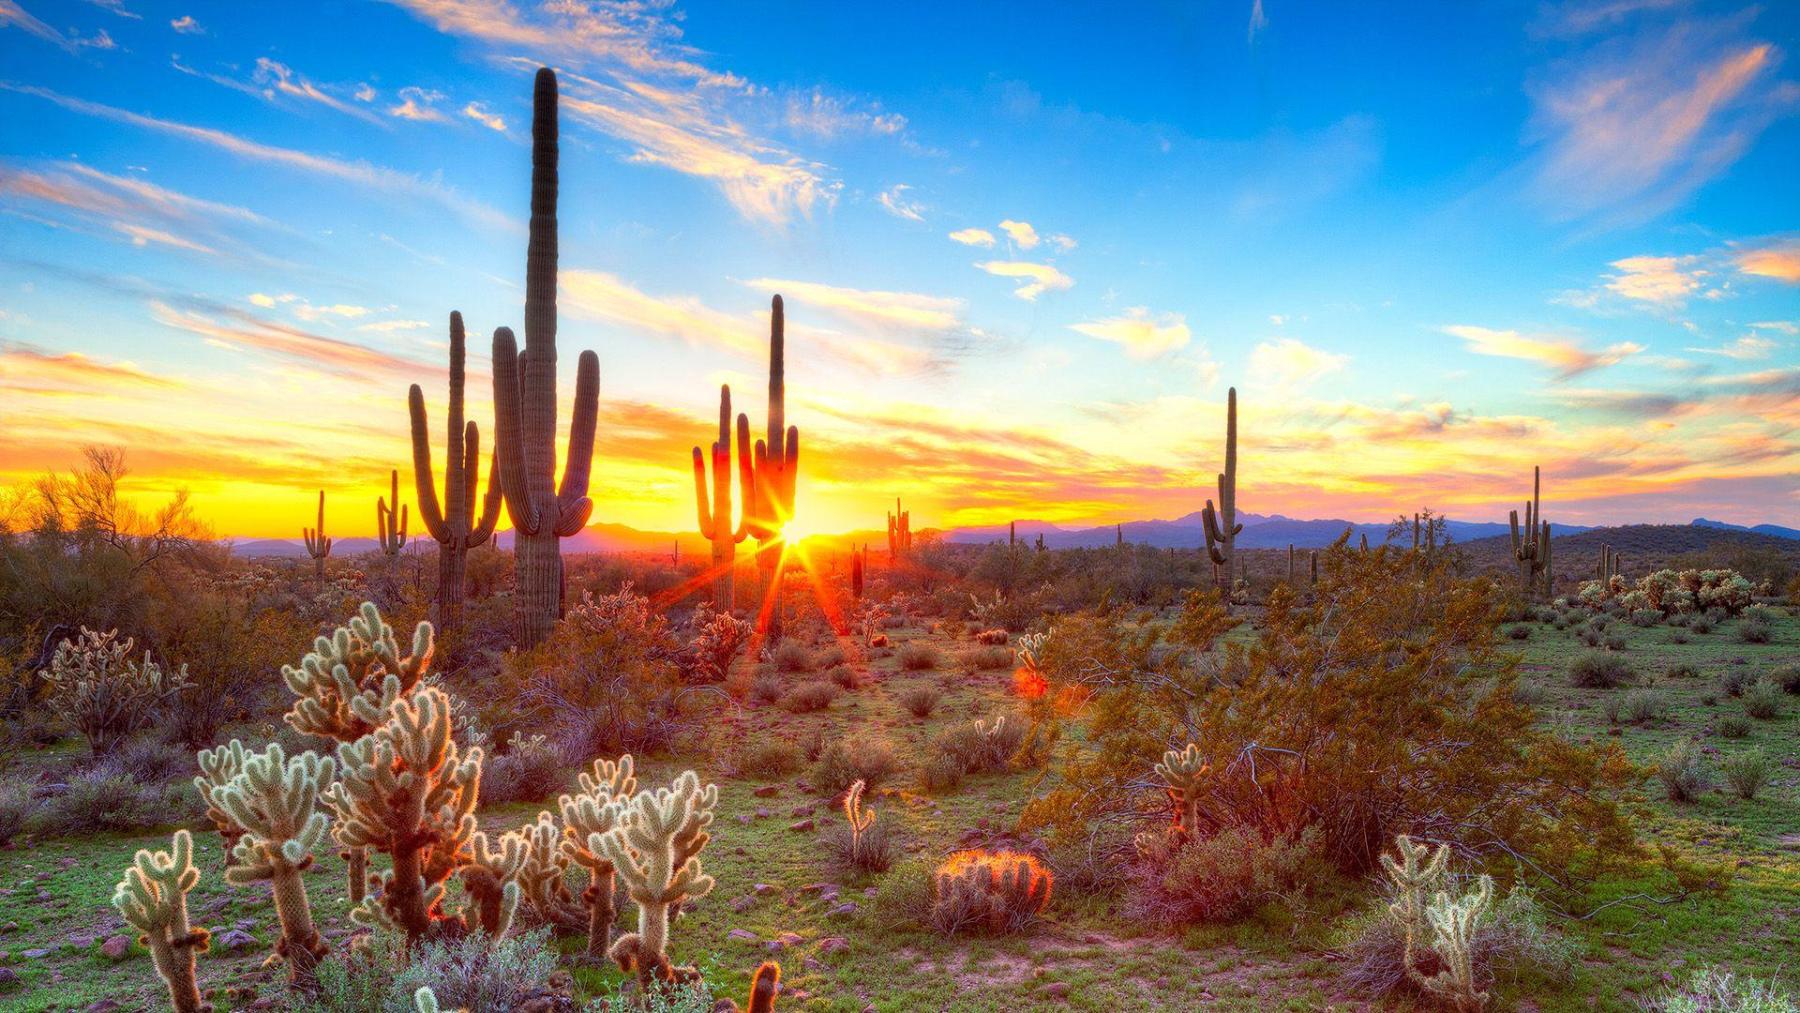
Statistical Analysis of the Climate and Precipitation of Arizona
by Berge Jerijian
This lesson is a four-day unit lesson that highlights the understanding of the climate, geography, trends in the change of temperature, and the related changes in precipitation in the state. This lesson uses data collected to create a Box and Whisker plot and use this plot to analyze the data, choose a scientific claim, and make a scientific argument to defend the choice in the claim.
Lesson Grade Level
6th GradeLesson Plan Link/URL
https://docs.google.com/presentation/d/1ut916MSZmjPisoLT0WFhaUKU6ioL74k1/edit?u…Subject Area
Science Earth and Space Science E1: Earth Systems E2: Earth & the Universe Technology 6. Creative Communicator 7. Global Collaborator Mathematics Measurement and Data (MD) Statistics and Probability (SP) English Language Arts (ELA) Reading (Informational Text)
Featured
Off
Related Content

Grades:
6th Grade, 7th Grade, 8th Grade
What would you do if you were dropped into the wilderness, with nothing but what you could fit into a backpack, and had to survive harsh weather, a hostile location, and possibly aggressive wildlife

Grades:
10th Grade, 11th Grade, 12th Grade
In this hands-on lesson, students study and record water quality readings by gaining an understanding of the significance of the readings along with the use of the correct vocabulary.
Grades:
9th Grade, 10th Grade, 11th Grade, 12th Grade
In this engaging lesson, students move the learning from within the classroom to outside its walls in order to study and record air quality readings (with no tech and tech applications). Students gain