Human Dot Plot - Part 2
by Laura Richmond
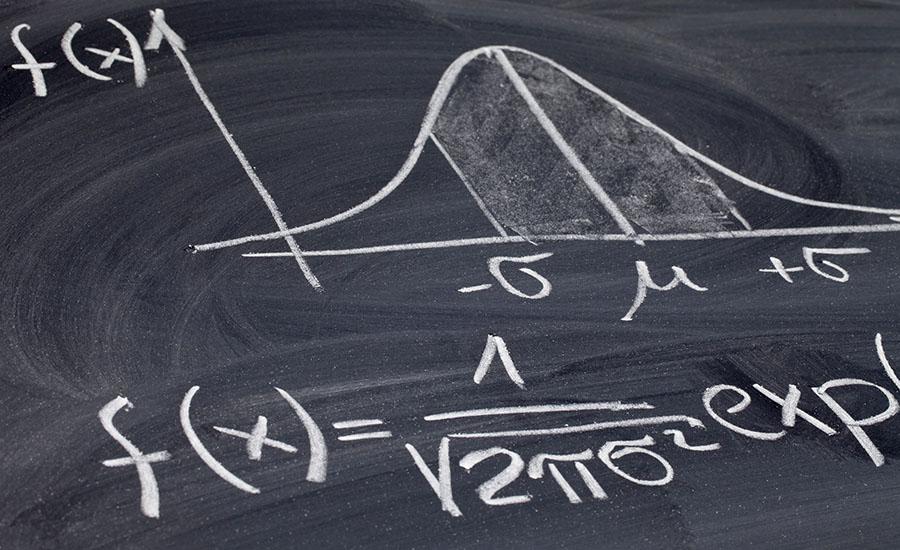
This is a continuation lesson in which we compare student data to the previous day's data using GeoGebra to help us generate dot plots and calculate statistics.
Lesson Plan Link/URL
https://docs.google.com/presentation/d/1ClNG_1KfLDBDOGXfTQr90-na3HmHkS1J/edit?u…Related Content

Grades:
9th Grade, 10th Grade, 11th Grade, 12th Grade
This lesson uses a Modeling Instruction approach to developing the graphical and mathematical relationship commonly known as Newton's 2nd Law for students in Grades 9-12. Students design an experiment

Grades:
9th Grade, 10th Grade, 11th Grade, 12th Grade
This STEM Argumentative Research Project engages students in exploring the scientific, ethical, and societal implications of themes in Mary Shelley's "Frankenstein." Students will work in groups to

Grades:
7th Grade, 8th Grade, 9th Grade, 10th Grade, 11th Grade, 12th Grade
Students will combine science and art by using an alternative photographic process called cyanotypes or sun prints. After a short introduction to the history of cyanotypes and the process of creating