Grades:
2nd Grade
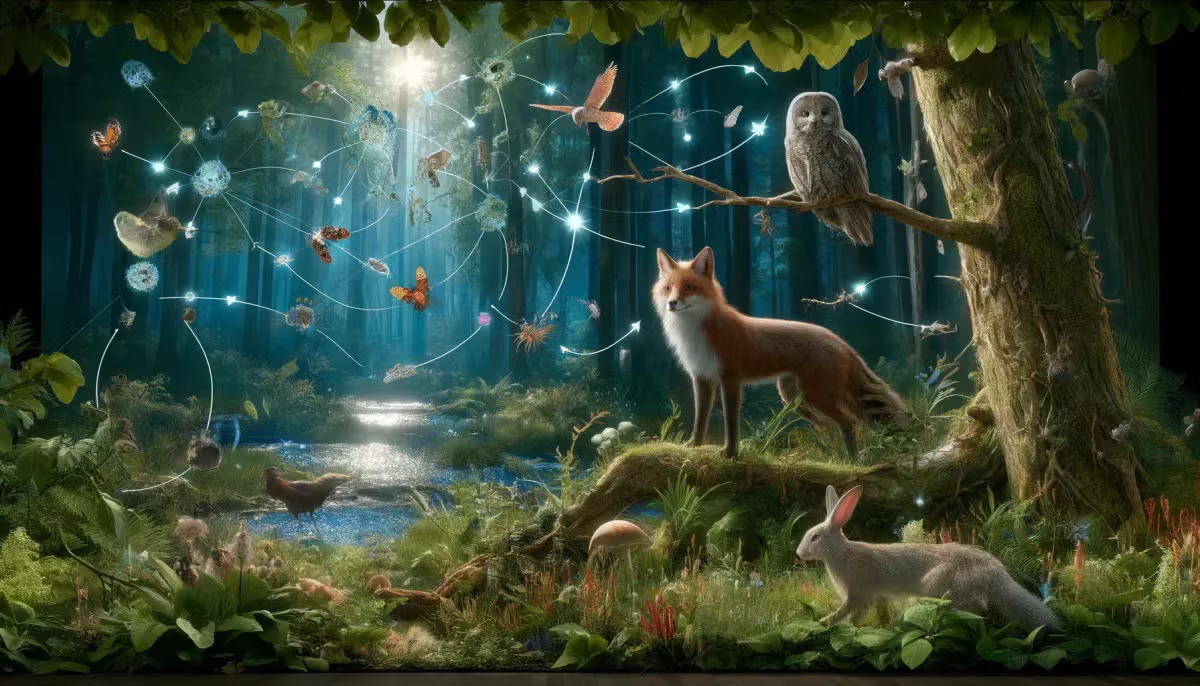
Students will learn about the adaptation of camouflage through picture books and research. They will then learn about animals specific to the area. (In this lesson, we are using the Bill Williams

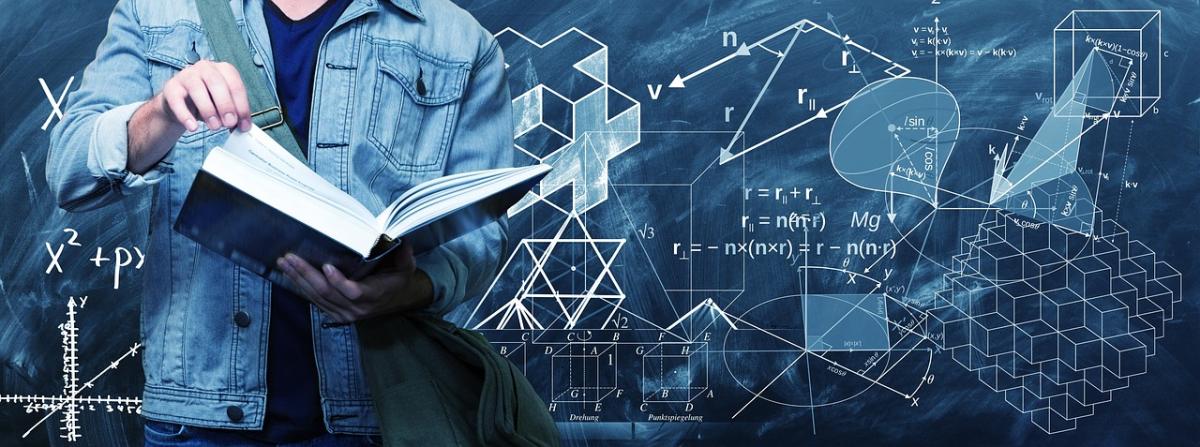


This is a simple and effective lesson that explores the science behind pendulums. Students make a basic pendulum to explore the variables of mass and string length and compare results to their
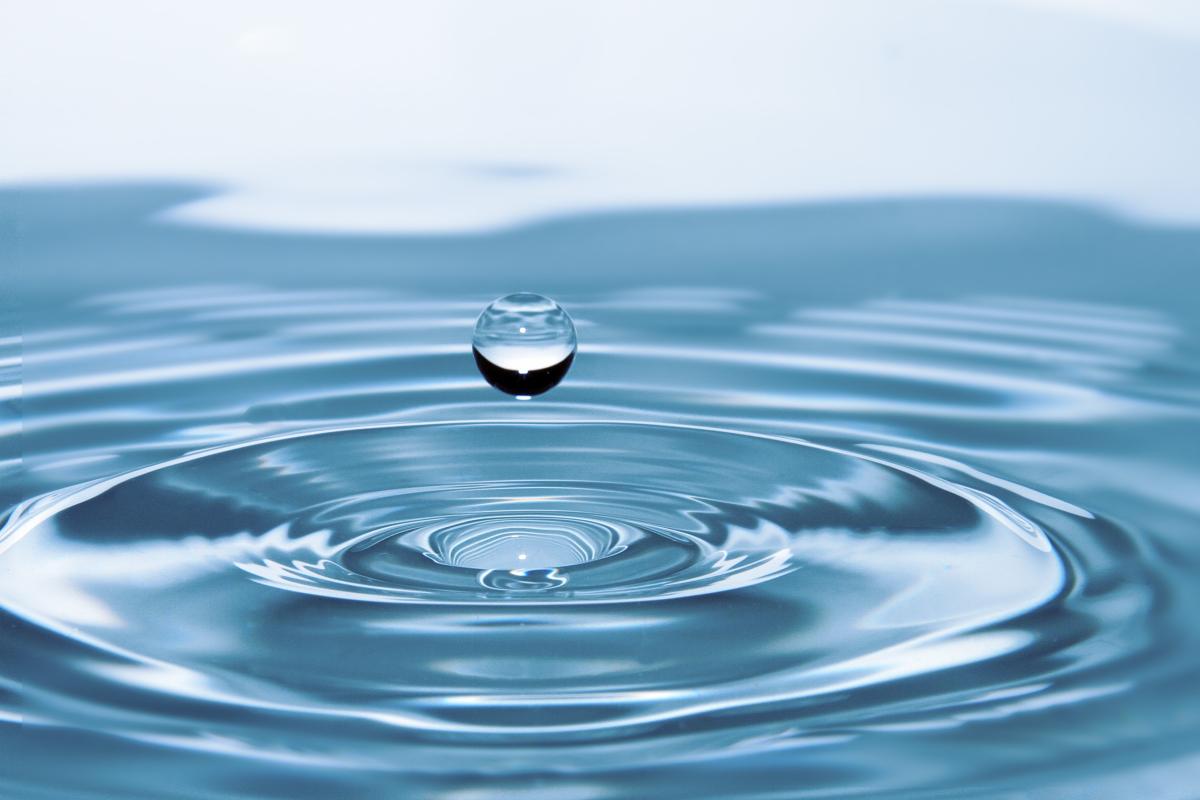
This lesson will allow students to measure the health of the water from sources in their community or everyday life. Students will measure the pH from different sources using test strips and a color
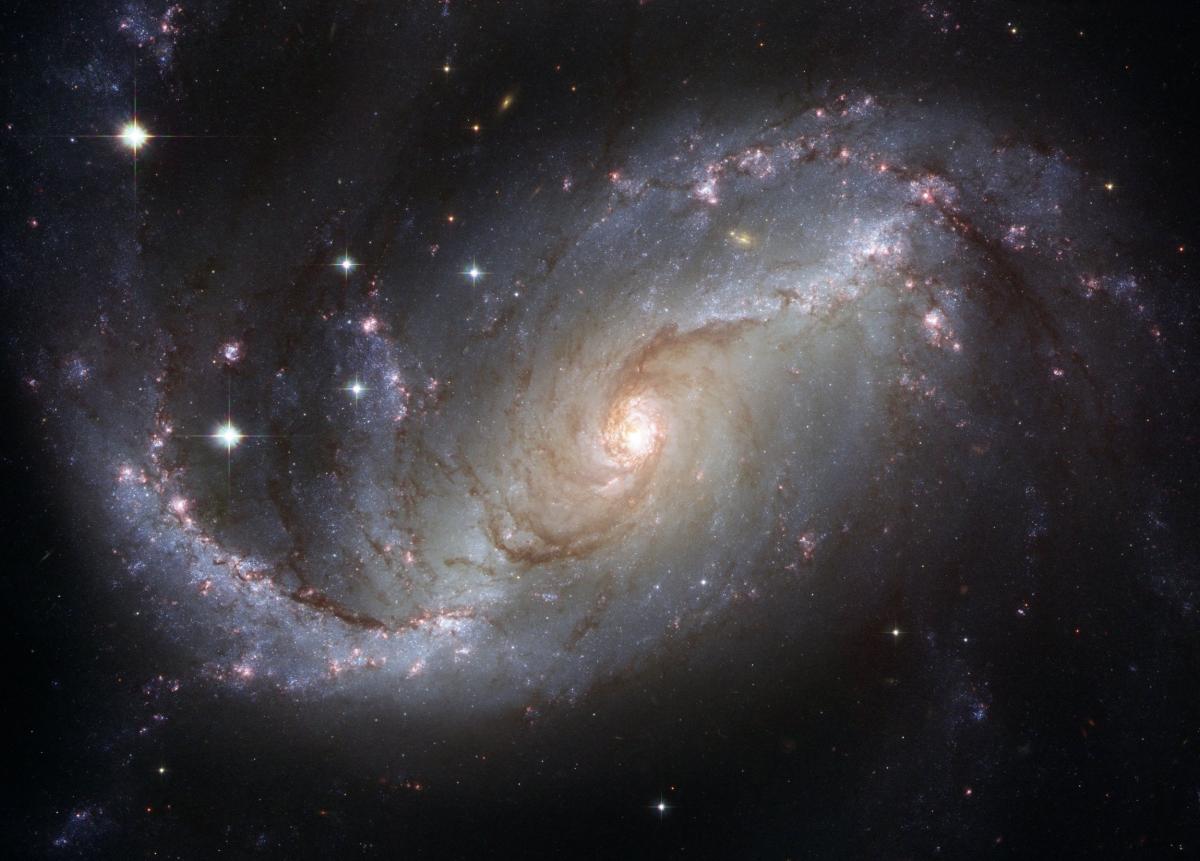
In this hands-on lesson, students create solid fuel rockets to explore the idea of parabolic motion and outside factors which can affect the path of a rocket. This lesson has enrichment involving the