Preserving Pumpkins
by Tonya Page
Students will go through the process of counting pumpkin seeds and analyzing data through mean, median and mode as well as creating correlating graphs. Students will learn what causes fruit decomposition and be able to experiment with different preservation choices to determine the best way to preserve pumpkins.
Lesson Grade Level
6th GradeLesson Plan Link/URL
https://docs.google.com/presentation/d/1M2O8sq_YDKa5_Li5CAUQiUC1s_OJmdL7/edit?u…Subject Area
Science Life Science L1: Cells L2: Organisms & Energy Technology 1. Empowered Learner 5. Computational Thinker 6. Creative Communicator Engineering Mathematics Counting and Cardinality (CC) Number and Operations in Base Ten (NBT) Measurement and Data (MD) Number & Quantity (N) English Language Arts (ELA) Reading (Literature) Reading (Informational Text) Writing Speaking & ListeningRelated Content
Grades:
3rd Grade
Students will describe the role of pollinators and explain their effects. They will be able to identify how the life cycle of a plant and a pollinator are connected. Students will also get to explore
Grades:
5th Grade, 6th Grade
This hands-on lesson has students create a barometer using a jar, balloon, stir stick and tape. They collect data over a span of time and graph it to understand how a barometer works and how it
Grades:
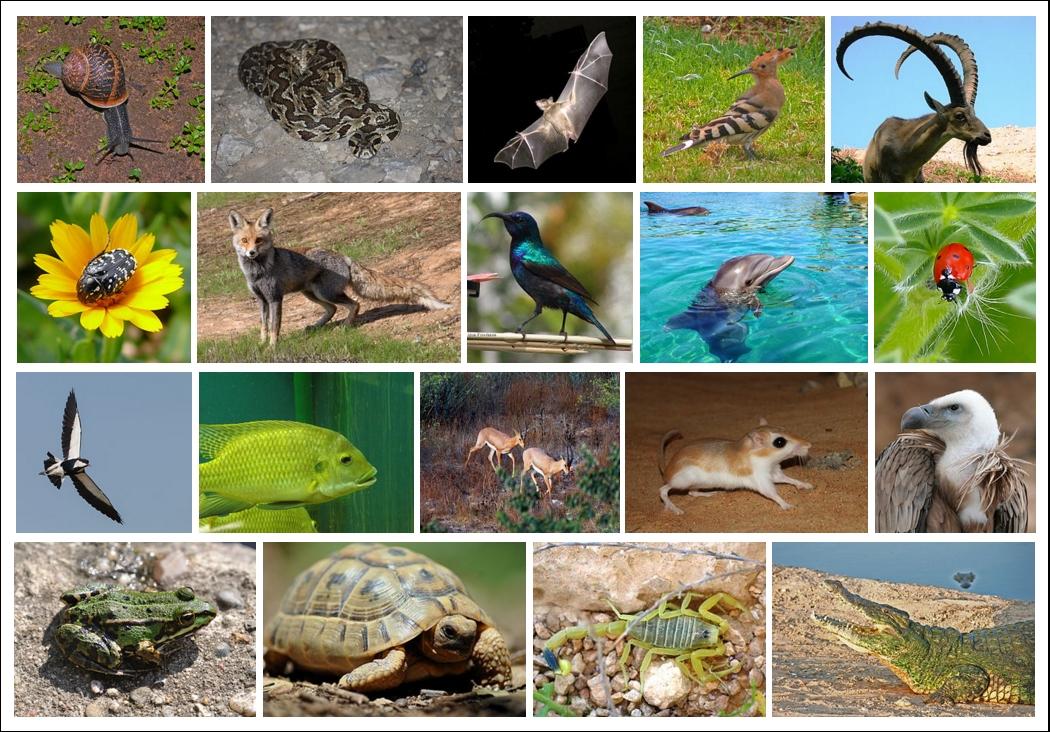
3rd Grade
In this lesson, students will create a unique animal and then describe & draw it in a specific habitat. The students will determine what adaptations the animal needs to survive in the habitat and