ELISA Disease Detection Test
by Miranda Thornton
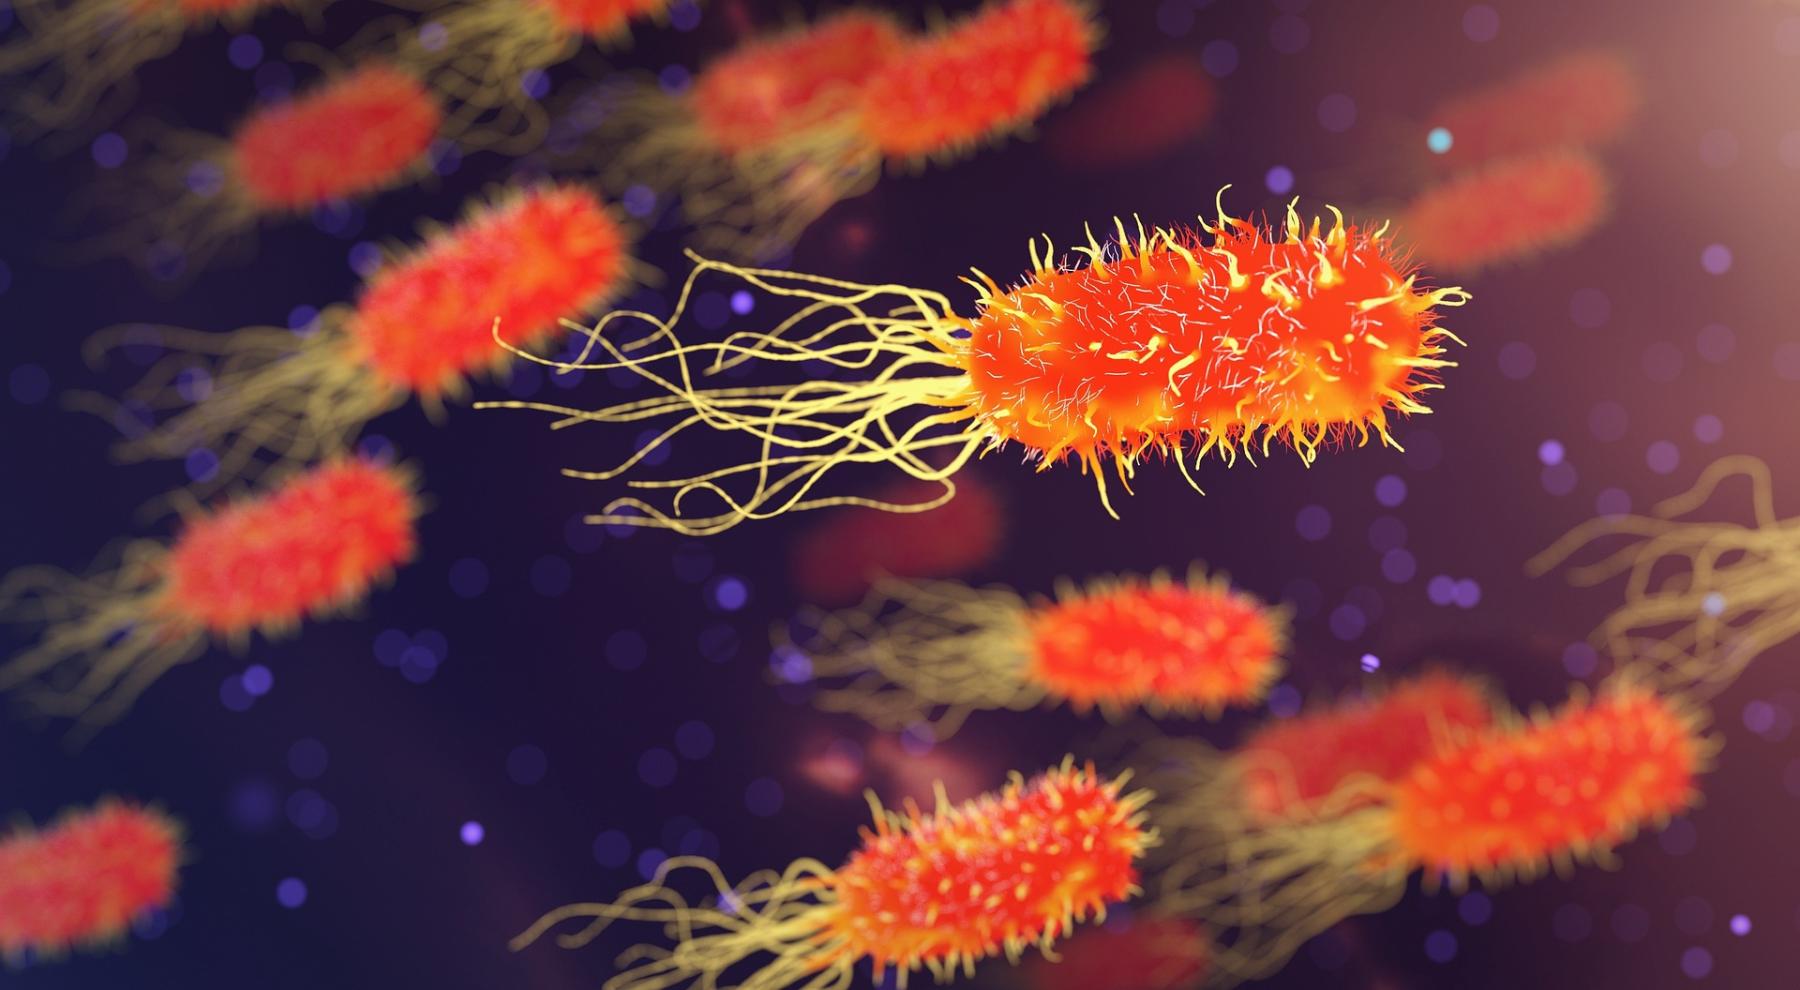
In this laboratory you will use the ELISA (Enzyme Linked ImmunoSorbent Assay) for detecting the presence of an antigen, such as a disease-related agent, from a sample of body fluid. You will be given a solution that represents your body fluid. You will exchange body fluid with three other individuals. The ELISA test will be used to detect a simulated disease agent in the mixed body fluids. Finally, you will analyze the class data set to determine identity of the original carrier(s).
This assay is similar to that used for the AIDS test, in which an ELISA is used to detect individuals infected with the virus that causes AIDS (HIV).
Lesson Plan Link/URL
https://docs.google.com/presentation/d/1Y8g9QGlG1jbbmjsY1kKSNjFBwmCTnST8/edit?u…Related Content

Grades:
6th Grade, 7th Grade, 8th Grade, 9th Grade, 10th Grade, 11th Grade, 12th Grade
Are your students fans of Formula 1? If they are or aren't this lesson will take a look into the dominance of Red Bull Racing in Formula 1. Why is Red Bull so dominant? Is it the driver or the

Grades:
9th Grade, 10th Grade, 11th Grade, 12th Grade
Students will work in small groups to create a water filtration system to demonstrate understanding of water purification systems and human influences.
Grades:
9th Grade, 10th Grade, 11th Grade, 12th Grade
Students pull wooden "sleds" with different masses on them over various types of surfaces with spring scales (force meters) to calculate the different coefficients of friction. Students graph the data