All Graphs Tell a Story
by Tianna Griffin
In this activity, students will use a table to organize information, create a graph to display data and use the correct labels. Students will also recognize the relationship among the table, the graph, and the slope of a line as the constant rate of change.
Lesson Grade Level
8th GradeLesson Plan Link/URL
https://docs.google.com/presentation/d/16Lvi_MJ8Ho-CClOPuUlgVqaJz6XxUN96/edit?u…Subject Area
Technology 5. Computational Thinker Mathematics Measurement and Data (MD) Functions (F)
Featured
Off
Related Content

Grades:
8th Grade, 9th Grade
Make quadratics come alive with stomp rockets! This is a 3-4 hour learning experience where students will build and launch paper rockets, then use the data to create quadratic equations.

Grades:
6th Grade, 7th Grade, 8th Grade
This is an 8-lesson unit that is designed to be used together to learn about the health and diversity of your local watershed by placing leaf packs into a water source (natural or man-made ponds

Grades:
6th Grade, 7th Grade, 8th Grade, 9th Grade, 10th Grade, 11th Grade, 12th Grade
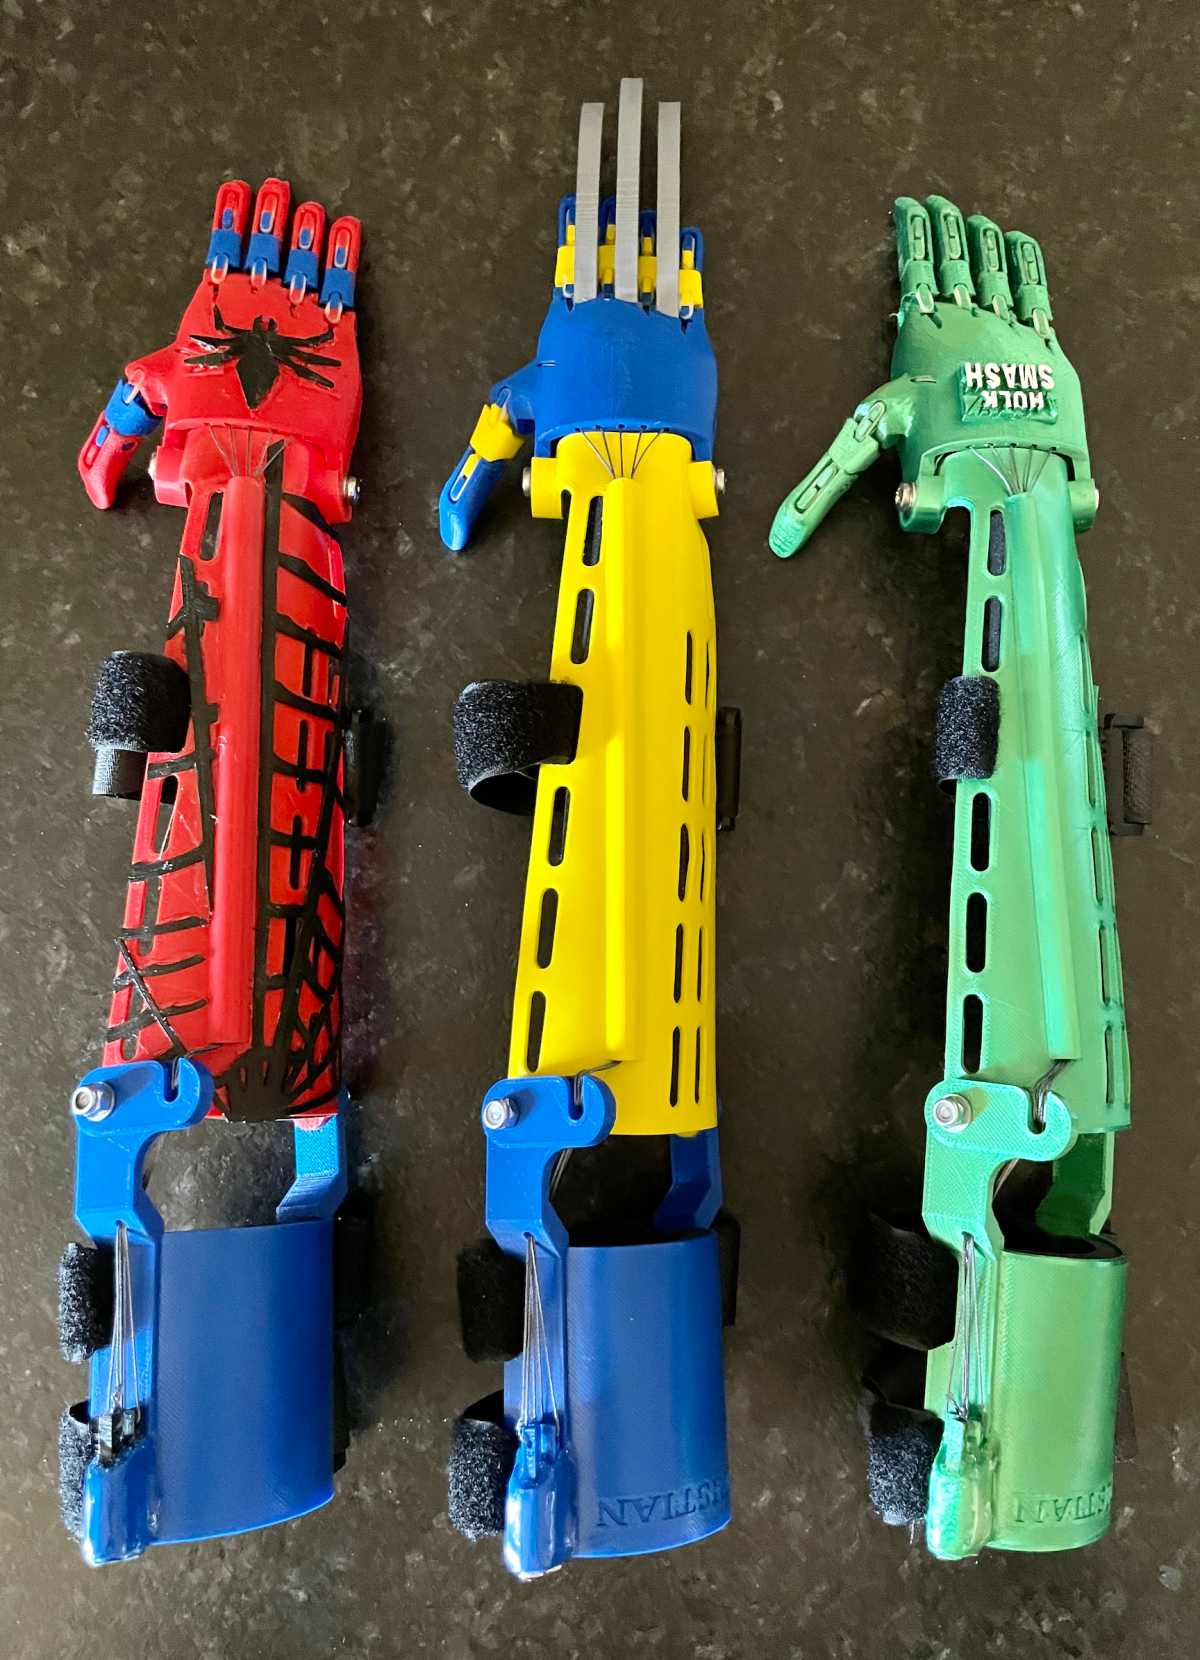
Be a part of the humanitarian effort and teach students how to create a fully functioning 3D printed prosthetic arm for a client in need. This lesson walks you through the process in a slideshow