Students will investigate the geological features of the Santa Catalinas. Specifically the phenomenon of Catalina Gneiss. Students will research the formation of the Tucson basin and Santa Catalinas

Students will investigate the geological features of the Santa Catalinas. Specifically the phenomenon of Catalina Gneiss. Students will research the formation of the Tucson basin and Santa Catalinas

Students are introduced to the javelina through reading part of The Three Little Javelinas, reading about javelinas and watching an informational video. They discover potential conflicts and root

In this lesson students model a fast change to Earth's surface by creating a landslide and a slow change to Earth's surface by simulating coastal erosion.

Students will use evidence from an investigation to model and explain how thermal expansion of land and sea ice impact the sea level. They will quantify the impact of land ice melt and thermal

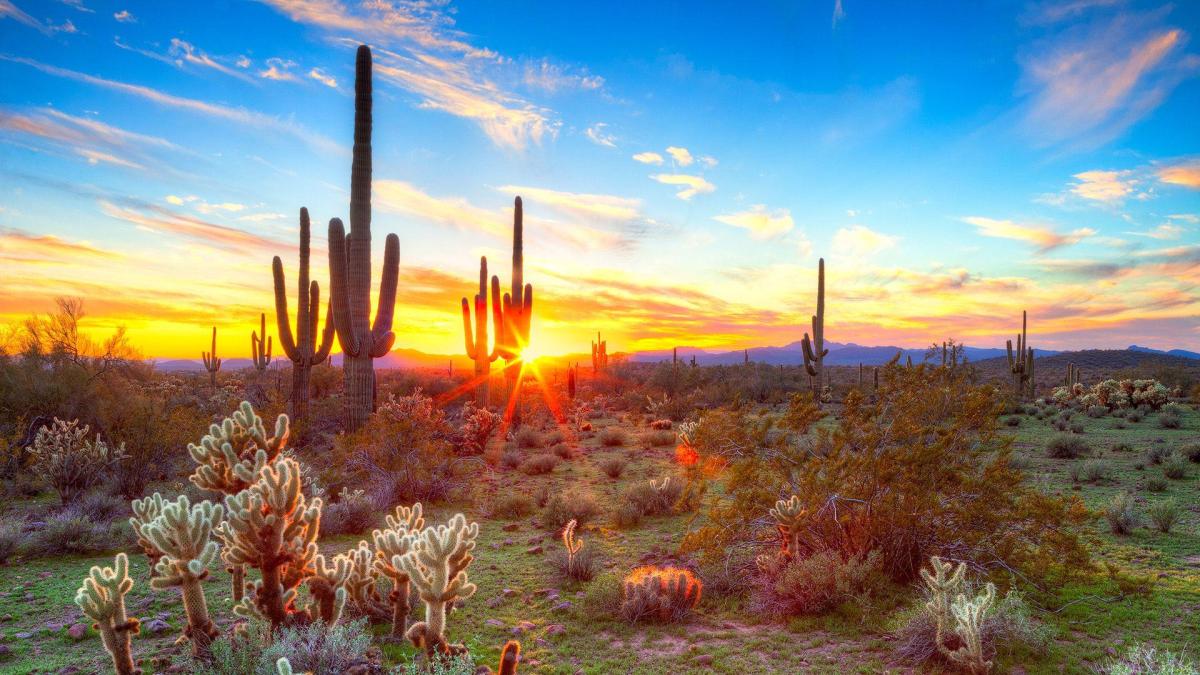
Saguaro cacti are collapsing in the Phoenix due to extreme heat and the urban island effect. Is there anyway to save them? This lesson allows students to investigate the factors contributing to the

Part 1: Rotation and Revolution (of Earth) Phenomenon: Why do we experience periods of day and night? This is a 1 to 3-day lesson with five activities primarily focusing on rotation of the Earth which

The lesson is adapted from resources created by the Green Drone AZ Project. This is module 1 of 4 featuring focused activities to address real-world environmental challenges within Arizona communities

In this lesson, students will be introduced to the concept of solar angle and how Earth’s tilt on its axis and revolution around the sun are responsible for seasonal changes in temperature, daylight

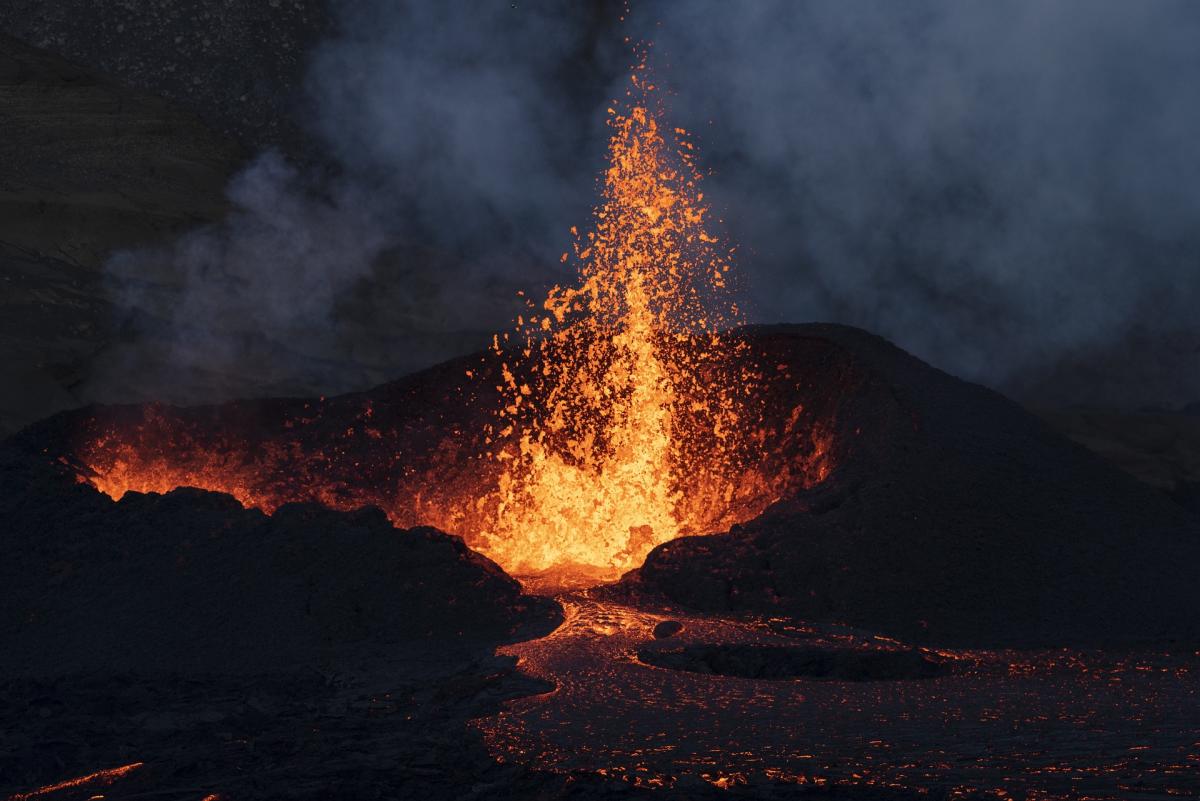
In this activity, students will build a shelter that protects them (cotton balls) from a volcanic eruption of lava and ash.