Density and Graphing
This lesson involves students calculating the density of various objects of differing sizes of the same substance. Each student group will need a balance, a ruler, and/or a graduated cylinder. They use their collected data to create a graph showing the relationship between mass and volume. The slope of the line created will be the density of the substance, which is consistent for all different volumes or masses so long as the substance stays the same. They will use their knowledge of density and graphing to suggest the solution to an imaginary problem in which a student wants to know if the bike they ordered is made of aluminum as it is supposed to be.
Lesson Plan Link/URL
https://docs.google.com/presentation/d/1CxKJm6qYjmYH-ClEDG8su9CIfal3Bk90/edit?u…Related Content
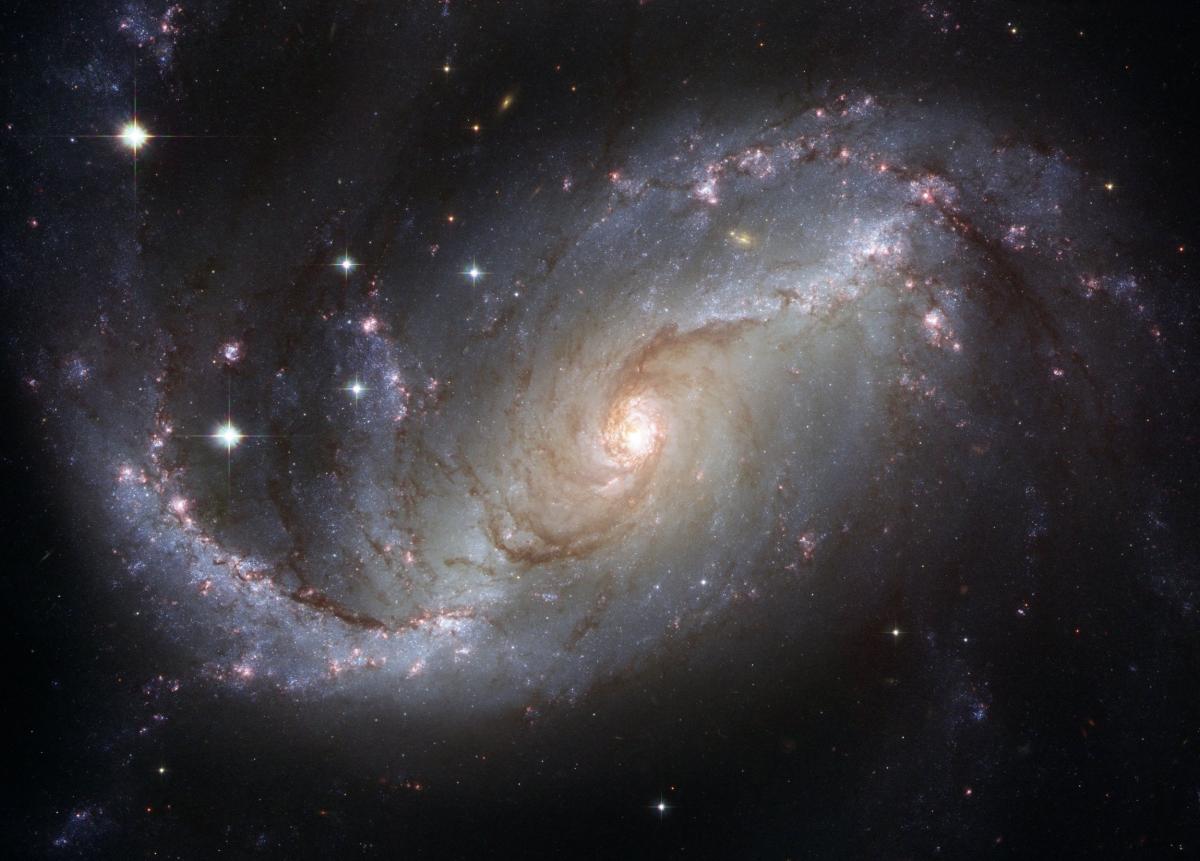
This engaging lesson is an introductory lesson regarding the size and scale of the Universe and objects within. This was designed for high school Astronomy but is easily useable with ages down through
This lesson give emphasis on the systems A and B of the chemical reaction that represent the reactants and products. This also focuses on investigating not just the system involved in the chemical

This is a two-day introductory lab exercise using video analysis to derive the equations that govern projectile motion. It employs elements of Modeling Instruction to engage students in doing science.