Data Literacy: Slow Reveal Graphs and Interpreting Data
by Nina Hipps
Use slow reveal graphs to get students thinking about data in graphs. Students also create graphs using online data or data they have generated. Interpret, analyze, predict using graphs.
Lesson Grade Level
7th GradeLesson Plan Link/URL
https://docs.google.com/presentation/d/1eszEHs47scGG_8_jxHG6_-m_EHvFKMfm/edit?u…Related Content

Grades:
4th Grade
Hike the trail to the Fort Bowie visitor's center and collect data on plants and artifacts you see there. This lesson involves data collection in the field and creative graphing in the classroom.

Grades:
7th Grade, 8th Grade
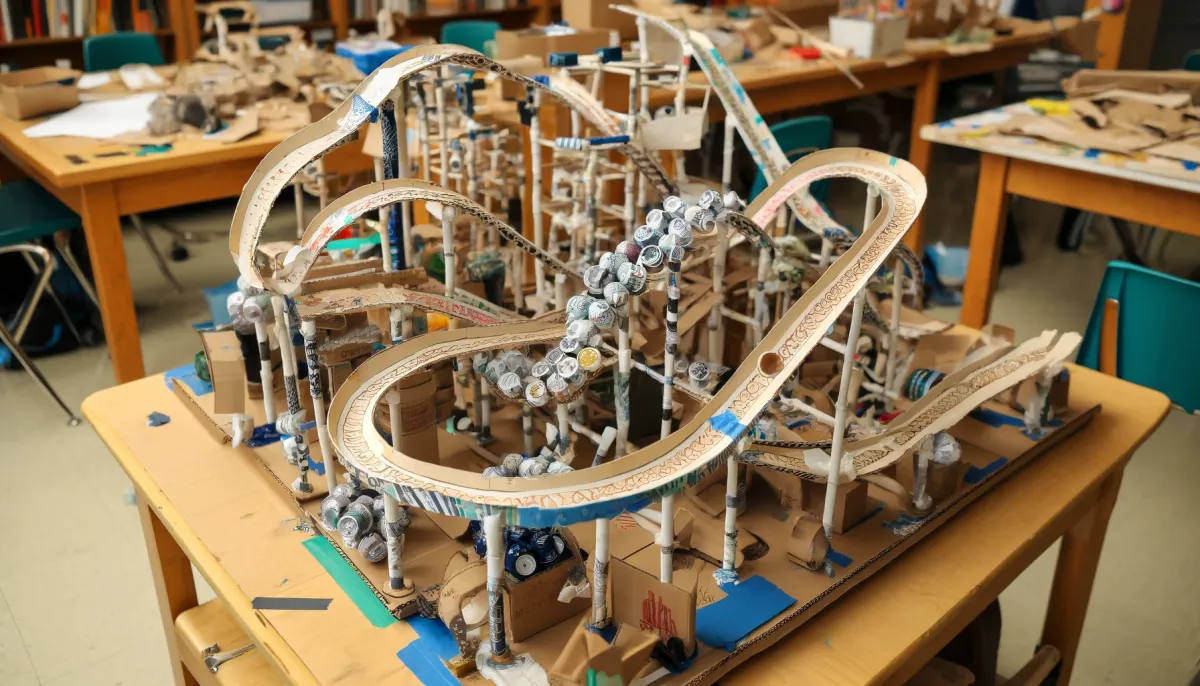
Students will learn cardboard construction through brainstorming, planning, building, and presenting creative projects, focusing on teamwork, structural integrity, and problem-solving over three class

Grades:
7th Grade, 8th Grade, 9th Grade, 10th Grade, 11th Grade, 12th Grade
Students will apply principles of design, engineering, and mathematics to create a physical or digital labyrinth inspired by the myth of Theseus. This project integrates STEM concepts with literature